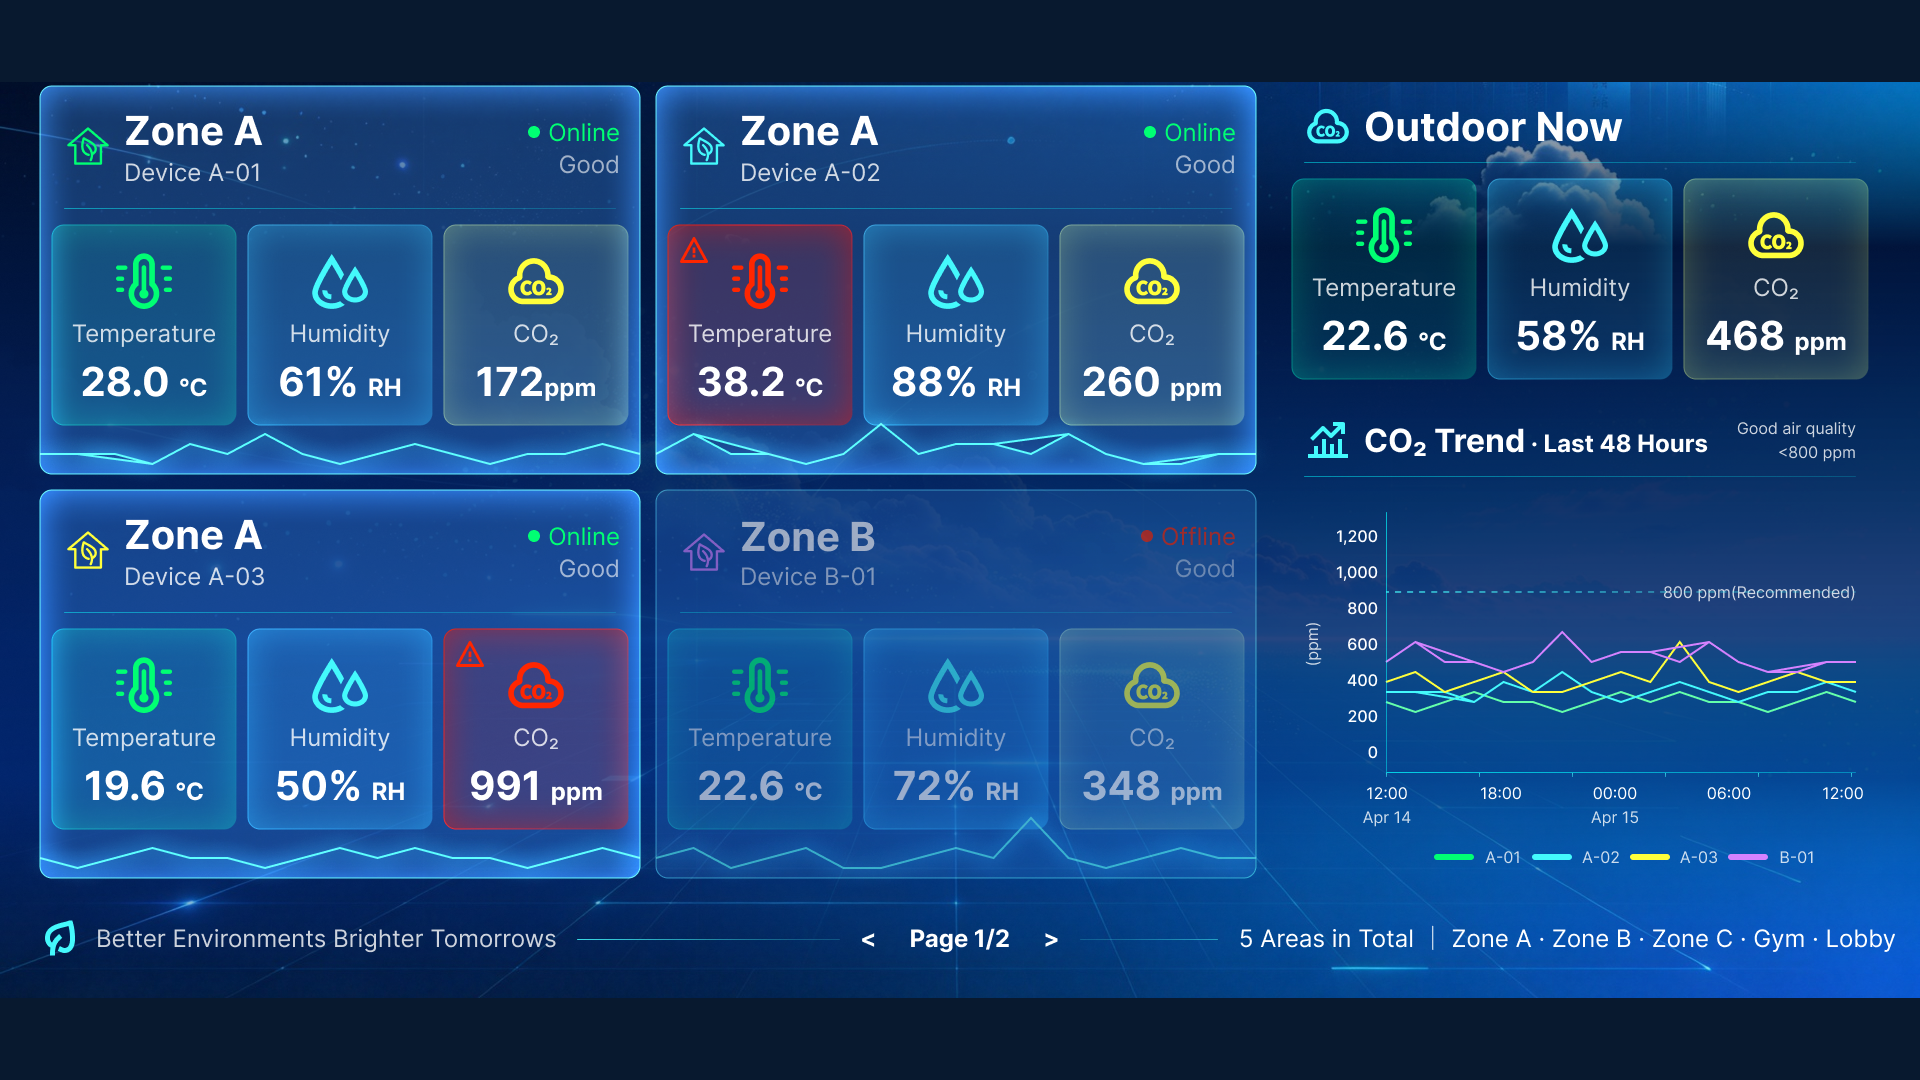


IoT sensors tracked CO₂, temperature and humidity at multiple points in a university dining area to help facilities staff assess ventilation.
A dining area gets busier at mealtimes, and readings can vary between entrances, seating areas and points near air supply vents. Comparing readings across locations and times helps facilities staff see where changes recur and decide where to investigate.
The dashboard shows temperature, humidity, CO₂ and device status for each monitoring point. Staff can check whether a sensor is reporting before comparing it with nearby sensors. When a device is offline, the first step is to check whether data collection has been interrupted.
The dashboard pairs current outdoor readings with 48 hours of indoor CO₂ trends. Staff can compare busy and quiet periods or review changes after adjusting the fresh-air supply. If readings repeatedly rise at one point around lunch, staff can check occupancy and ventilation operation on site.
Dashboard details
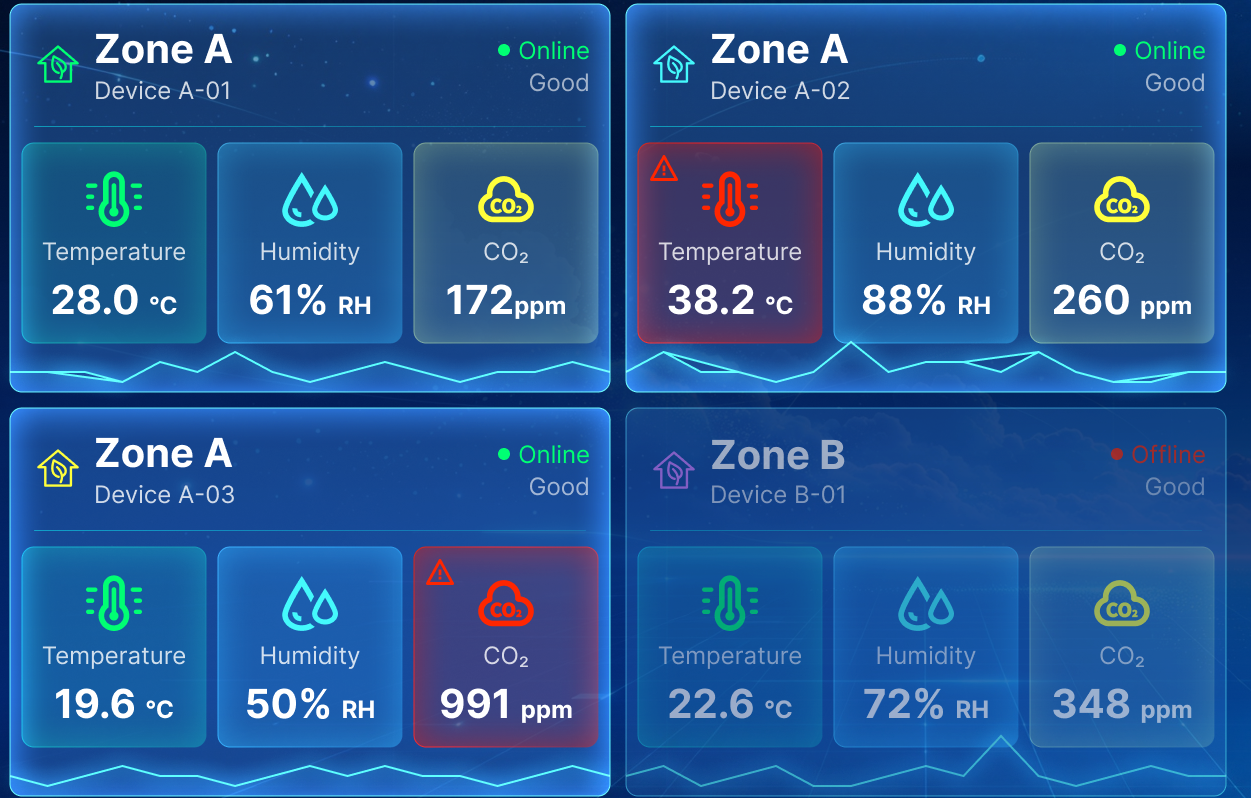
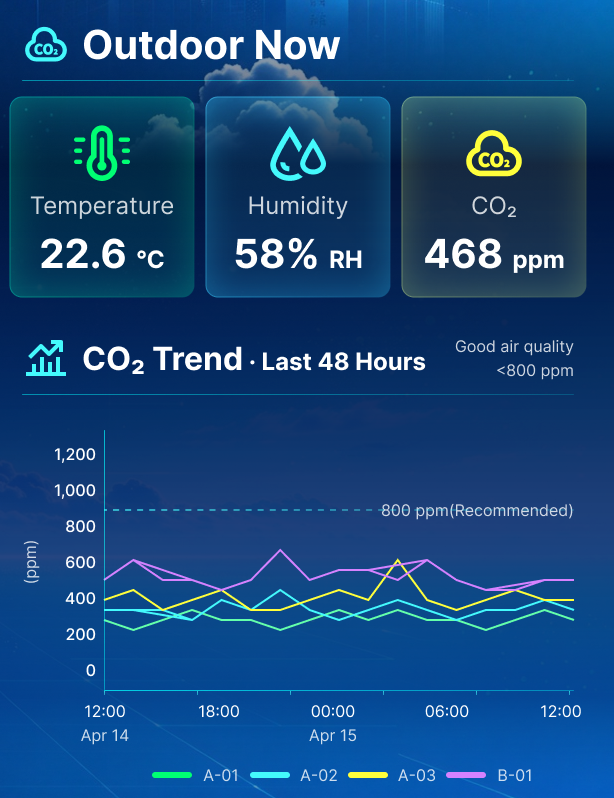
The images show an anonymized dashboard design. Readings are shown for illustration. View the full dashboard